
Note
Go to the end to download the full example code.
Transmission Electron Microscopy (TEM) dataset
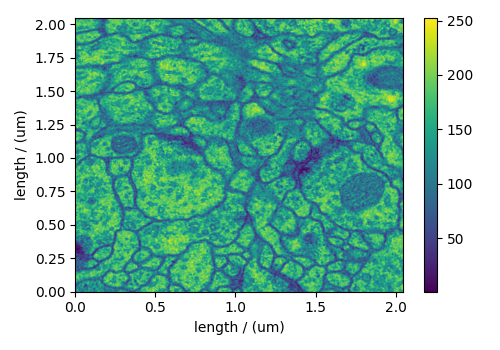
The following TEM dataset is a section of an early larval brain of Drosophila melanogaster used in the analysis of neuronal microcircuitry. The dataset was obtained from the TrakEM2 tutorial and subsequently converted to the CSD model file-format.
Let’s import the CSD model data-file and look at its data structure.
import matplotlib.pyplot as plt

import csdmpy as cp

filename = "https://www.ssnmr.org/sites/default/files/CSDM/TEM/TEM.csdf"
TEM = cp.load(filename)
print(TEM.data_structure)
{
  "csdm": {
    "version": "1.0",
    "read_only": true,
    "timestamp": "2016-03-12T16:41:00Z",
    "description": "TEM image of the early larval brain of Drosophila melanogaster used in the analysis of neuronal microcircuitry.",
    "dimensions": [
      {
        "type": "linear",
        "count": 512,
        "increment": "4.0 nm",
        "quantity_name": "length",
        "reciprocal": {
          "quantity_name": "wavenumber"
        }
      },
      {
        "type": "linear",
        "count": 512,
        "increment": "4.0 nm",
        "quantity_name": "length",
        "reciprocal": {
          "quantity_name": "wavenumber"
        }
      }
    ],
    "dependent_variables": [
      {
        "type": "internal",
        "numeric_type": "uint8",
        "quantity_type": "scalar",
        "components": [
          [
            "126, 107, ..., 164, 171"
          ]
        ]
      }
    ]
  }
}
This dataset consists of two linear dimensions and one single-component dependent variable. The tuple of the dimension and the dependent variable instances from this example are
and the respective coordinates (viewed only for the first ten coordinates),
print(x[0].coordinates[:10])
[ 0. 4. 8. 12. 16. 20. 24. 28. 32. 36.] nm
print(x[1].coordinates[:10])
[ 0. 4. 8. 12. 16. 20. 24. 28. 32. 36.] nm
For convenience, let’s convert the coordinates from nm to µm using the
to() method of the respective Dimension instance,
x[0].to("µm")
x[1].to("µm")
and plot the data.
plt.figure(figsize=(5, 3.5))
ax = plt.subplot(projection="csdm")
cb = ax.imshow(TEM, aspect="auto")
plt.colorbar(cb, ax=ax)
plt.tight_layout()
plt.show()
Total running time of the script: (0 minutes 0.288 seconds)