
Note
Go to the end to download the full example code.
2D{1} dataset with two linear dimensions
In the following example, we illustrate how one can covert a Numpy array into a CSDM object. Start by importing the Numpy and csdmpy libraries.
import matplotlib.pyplot as plt
import numpy as np

import csdmpy as cp
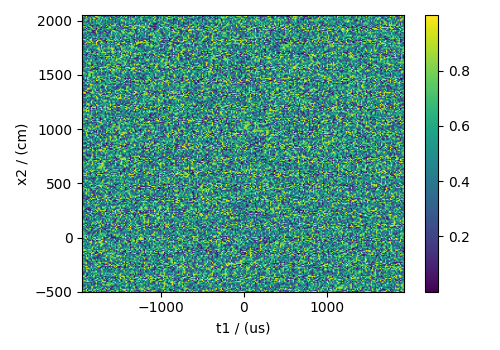
Let’s generate a 2D NumPy array of random numbers as our dataset.
data = np.random.rand(65536).reshape(256, 256)
Create the DependentVariable object from the numpy object.
dv = cp.as_dependent_variable(data, unit="Pa")
Create the two Dimension objects
d0 = cp.LinearDimension(
    count=256, increment="15.23 µs", coordinates_offset="-1.95 ms", label="t1"
)

d1 = cp.LinearDimension(
    count=256, increment="10 cm", coordinates_offset="-5 m", label="x2"
)
Here, d0 and d1 are LinearDimension objects with 256 points and 15.23 µs and
10 cm as increment.
Creating the CSDM object.
csdm_object = cp.CSDM(dependent_variables=[dv], dimensions=[d0, d1])
print(csdm_object.dimensions)
[LinearDimension(count=256, increment=15.23 µs, coordinates_offset=-1.95 ms, quantity_name=time, label=t1, reciprocal={'quantity_name': 'frequency'}),
LinearDimension(count=256, increment=10.0 cm, coordinates_offset=-5.0 m, quantity_name=length, label=x2, reciprocal={'quantity_name': 'wavenumber'})]
Plot of the dataset.
plt.figure(figsize=(5, 3.5))
ax = plt.subplot(projection="csdm")
cb = ax.imshow(csdm_object, aspect="auto")
plt.colorbar(cb, ax=ax)
plt.tight_layout()
plt.show()
To serialize the file, use the save method.
csdm_object.save("2D_1_dataset.csdf")
Total running time of the script: (0 minutes 0.096 seconds)