
2D CSDM objects with imshow()|contour()|contourf()
2D{1} datasets
import matplotlib.pyplot as plt
import numpy as np
import csdmpy as cp
# Create a test 2D{1} dataset. ================================================
# Step-1: Create dimension objects.
x1 = cp.as_dimension(np.arange(10) * 0.1 + 15, unit="s", label="t1")
x2 = cp.as_dimension(np.arange(10) * 12.5, unit="s", label="t2")
# Step-2: Create dependent variable objects.
y = cp.as_dependent_variable(np.diag(np.ones(10)), name="body-diagonal")
# Step-3: Create the CSDM object with Dimension and Dependent variable objects.
csdm = cp.CSDM(dimensions=[x1, x2], dependent_variables=[y])
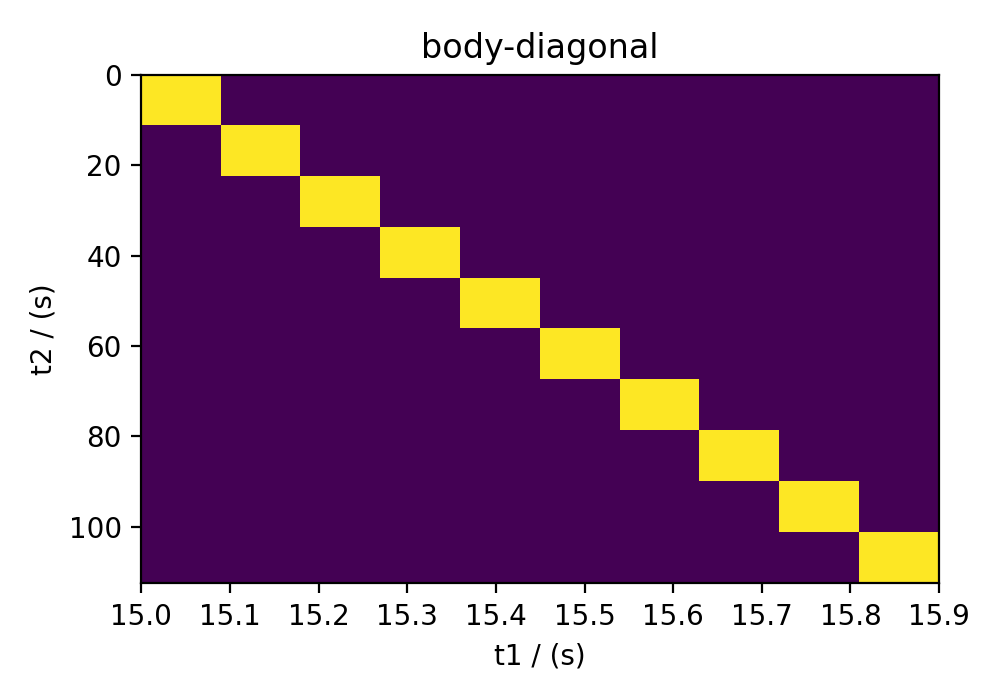
# Plot imshow =================================================================
plt.figure(figsize=(5, 3.5))
# create the axes with `projection="csdm"`
ax = plt.subplot(projection="csdm")
# use matplotlib imshow function with csdm object.
ax.imshow(csdm, origin="upper", aspect="auto")
plt.tight_layout()
plt.show()
(Source code, png, hires.png, pdf)

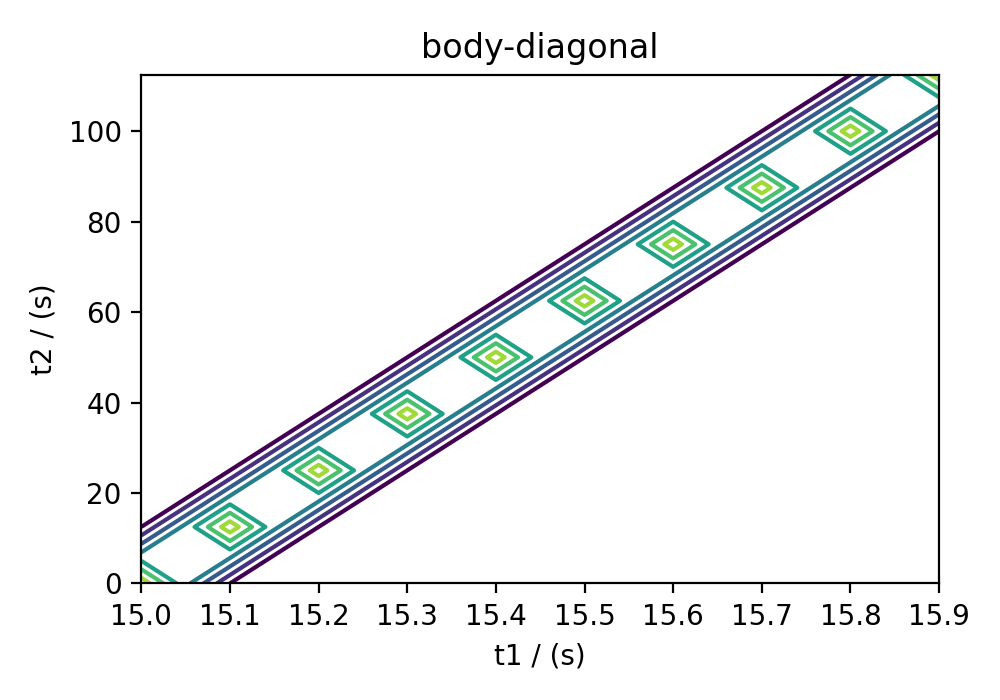
# Plot contour ================================================================
plt.figure(figsize=(5, 3.5))
# create the axes with `projection="csdm"`
ax = plt.subplot(projection="csdm")
# use matplotlib contour function with csdm object.
ax.contour(csdm)
plt.tight_layout()
plt.show()
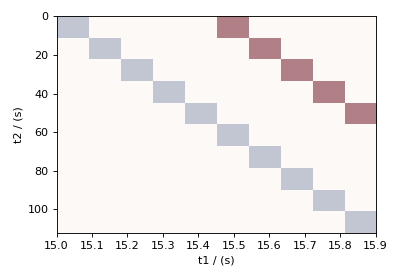
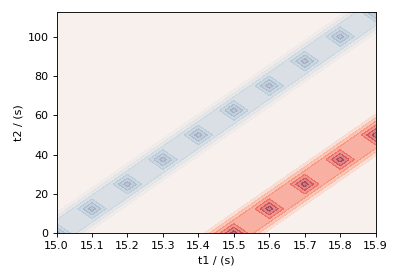
2D{1, 1, ..} datasets
Plotting on the same Axes
When multiple single-component dependent variables are present within the CSDM object, the data from all dependent-variables is plotted on the same axes. The name of each dependent variable is displayed along the color bar.
import matplotlib.pyplot as plt
import numpy as np

import csdmpy as cp

# Create a test 2D{1} dataset. ================================================

# Step-1: Create dimension objects.
x1 = cp.as_dimension(np.arange(10) * 0.1 + 15, unit="s", label="t1")
x2 = cp.as_dimension(np.arange(10) * 12.5, unit="s", label="t2")

# Step-2: Create dependent variable objects.
y1 = cp.as_dependent_variable(np.diag(np.ones(10)), name="body-diagonal")
y2 = cp.as_dependent_variable(np.diag(np.ones(5), 5), name="off-body-diagonal")

# Step-3: Create the CSDM object with Dimension and Dependent variable objects.
csdm = cp.CSDM(dimensions=[x1, x2], dependent_variables=[y1, y2])

# Plot imshow =================================================================
plt.figure(figsize=(5, 3.5))
# create the axes with `projection="csdm"`
ax = plt.subplot(projection="csdm")
# use matplotlib imshow function with csdm object.
ax.imshow(csdm, origin="upper", aspect="auto", cmaps=["Blues", "Reds"], alpha=0.5)
plt.tight_layout()
plt.show()
(Source code, png, hires.png, pdf)
# Plot contourf ===============================================================
plt.figure(figsize=(5, 3.5))
# create the axes with `projection="csdm"`
ax = plt.subplot(projection="csdm")
# use matplotlib contourf function with csdm object.
ax.contourf(csdm, cmaps=["Blues", "Reds"], alpha=0.5)
plt.tight_layout()
plt.show()
Plotting on separate Axes
To plot the data from individual dependent variables onto separate axes, use the
split() method to first split the CSDM object with n dependent
variables into n CSDM objects with single dependent variables, and then plot them
separately.