
Note
Go to the end to download the full example code.
Vector, 1D{2} dataset
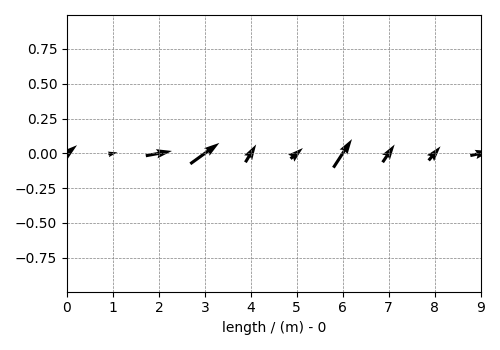
The 1D{2} datasets are one-dimensional, \(d=1\), with two-component dependent variable, \(p=2\). Such datasets are more common with the weather forecast, such as the wind velocity predicting at a location as a function of time.
The following is an example of a simulated 1D vector field dataset.
import matplotlib.pyplot as plt

import csdmpy as cp

filename = "https://www.ssnmr.org/sites/default/files/CSDM/vector/1D_vector.csdf"
vector_data = cp.load(filename)
print(vector_data.data_structure)
{
  "csdm": {
    "version": "1.0",
    "read_only": true,
    "timestamp": "2019-02-12T10:00:00Z",
    "dimensions": [
      {
        "type": "linear",
        "count": 10,
        "increment": "1.0 m",
        "quantity_name": "length",
        "reciprocal": {
          "quantity_name": "wavenumber"
        }
      }
    ],
    "dependent_variables": [
      {
        "type": "internal",
        "numeric_type": "float32",
        "quantity_type": "vector_2",
        "components": [
          [
            "0.6907923, 0.31292602, ..., 0.40570852, 0.7005596"
          ],
          [
            "0.5603441, 0.06866818, ..., 0.48200375, 0.15077808"
          ]
        ]
      }
    ]
  }
}
The tuple of the dimension and dependent variable instances from this example are
with coordinates
print(x[0].coordinates)
[0. 1. 2. 3. 4. 5. 6. 7. 8. 9.] m
In this example, the components of the dependent variable are
vectors as seen from the
quantity_type
attribute of the corresponding dependent variable instance.
print(y[0].quantity_type)
vector_2
From the value vector_2, vector indicates a vector dataset, while 2 indicates the number of vector components.
Visualizing the dataset
plt.figure(figsize=(5, 3.5))
cp.plot(vector_data)
plt.tight_layout()
plt.show()
Total running time of the script: (0 minutes 0.118 seconds)