
Note
Go to the end to download the full example code.
Astronomy dataset
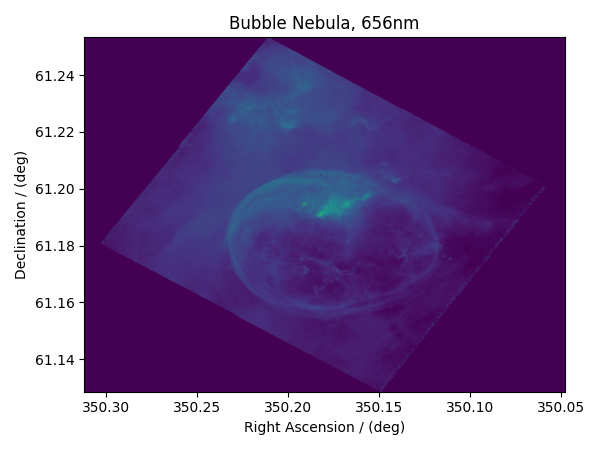
The following dataset is a new observation of the Bubble Nebula acquired by The Hubble Heritage Team, in February 2016. The original dataset was obtained in the FITS format and subsequently converted to the CSD model file-format. For the convenience of illustration, we have downsampled the original dataset.
Let’s load the .csdfe file and look at its data structure.
import matplotlib.pyplot as plt

import csdmpy as cp

domain = "https://www.ssnmr.org/sites/default/files/CSDM"
filename = f"{domain}/BubbleNebula/Bubble_nebula.csdf"
bubble_nebula = cp.load(filename)
print(bubble_nebula.data_structure)
{
  "csdm": {
    "version": "1.0",
    "timestamp": "2020-01-04T01:43:31Z",
    "description": "The dataset is a new observation of the Bubble Nebula acquired by The Hubble Heritage Team, in February 2016.",
    "dimensions": [
      {
        "type": "linear",
        "count": 1024,
        "increment": "-0.0002581136196 °",
        "coordinates_offset": "350.311874957 °",
        "quantity_name": "plane angle",
        "label": "Right Ascension"
      },
      {
        "type": "linear",
        "count": 1024,
        "increment": "0.0001219957797701109 °",
        "coordinates_offset": "61.12851494969163 °",
        "quantity_name": "plane angle",
        "label": "Declination"
      }
    ],
    "dependent_variables": [
      {
        "type": "internal",
        "name": "Bubble Nebula, 656nm",
        "numeric_type": "float32",
        "quantity_type": "scalar",
        "components": [
          [
            "0.0, 0.0, ..., 0.0, 0.0"
          ]
        ]
      }
    ]
  }
}
Here, the variable bubble_nebula is an instance of the CSDM
class. From the data structure, one finds two dimensions, labeled as
Right Ascension and Declination, and one single-component dependent
variable named Bubble Nebula, 656nm.
Let’s get the tuple of the dimension and dependent variable instances from
the bubble_nebula instance following,
There are two dimension instances in x. Let’s look
at the coordinates along each dimension, using the
coordinates attribute of the
respective instances.
print(x[0].coordinates[:10])
[350.31187496 350.31161684 350.31135873 350.31110062 350.3108425
 350.31058439 350.31032628 350.31006816 350.30981005 350.30955193] deg
print(x[1].coordinates[:10])
[61.12851495 61.12863695 61.12875894 61.12888094 61.12900293 61.12912493
 61.12924692 61.12936892 61.12949092 61.12961291] deg
Here, we only print the first ten coordinates along the respective dimensions.
The component of the dependent variable is accessed through the
components attribute.
y00 = y[0].components[0]
Visualize the dataset
from matplotlib.colors import LogNorm

plt.figure(figsize=(6, 4.5))
ax = plt.subplot(projection="csdm")
ax.imshow(bubble_nebula, norm=LogNorm(vmin=7.5e-3, clip=True), aspect="auto")
plt.tight_layout()
plt.show()
Total running time of the script: (0 minutes 0.372 seconds)