
Note
Go to the end to download the full example code.
Mass spectrometry (sparse) dataset
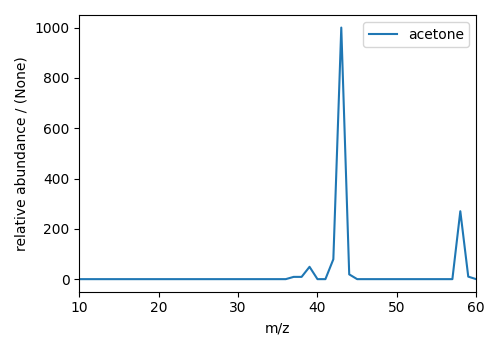
The following mass spectrometry data of acetone is an example of a sparse dataset. Here, the CSDM data file holds a sparse dependent variable. Upon import, the components of the dependent variable sparsely populates the coordinate grid. The remaining unpopulated coordinates are assigned a zero value.
import matplotlib.pyplot as plt

import csdmpy as cp

filename = "https://www.ssnmr.org/sites/default/files/CSDM/MassSpec/acetone.csdf"
mass_spec = cp.load(filename)
print(mass_spec.data_structure)
{
  "csdm": {
    "version": "1.0",
    "read_only": true,
    "timestamp": "2019-06-23T17:53:26Z",
    "description": "MASS spectrum of acetone",
    "dimensions": [
      {
        "type": "linear",
        "count": 51,
        "increment": "1.0",
        "coordinates_offset": "10.0",
        "label": "m/z"
      }
    ],
    "dependent_variables": [
      {
        "type": "internal",
        "name": "acetone",
        "numeric_type": "float32",
        "quantity_type": "scalar",
        "component_labels": [
          "relative abundance"
        ],
        "components": [
          [
            "0.0, 0.0, ..., 10.0, 0.0"
          ]
        ]
      }
    ]
  }
}
Here, the coordinates along the dimension are
print(mass_spec.dimensions[0].coordinates)
[10. 11. 12. 13. 14. 15. 16. 17. 18. 19. 20. 21. 22. 23. 24. 25. 26. 27.
 28. 29. 30. 31. 32. 33. 34. 35. 36. 37. 38. 39. 40. 41. 42. 43. 44. 45.
 46. 47. 48. 49. 50. 51. 52. 53. 54. 55. 56. 57. 58. 59. 60.]
and the corresponding components of the dependent variable,
print(mass_spec.dependent_variables[0].components[0])
[   0.    0.    0.    0.    0.    0.    0.    0.    0.    0.    0.    0.
    0.    0.    0.    0.    0.    0.    0.    0.    0.    0.    0.    0.
    0.    0.    0.    9.    9.   49.    0.    0.   79. 1000.   19.    0.
    0.    0.    0.    0.    0.    0.    0.    0.    0.    0.    0.    0.
  270.   10.    0.]
Note, only eight values were listed in the dependent variable’s components attribute in the .csdf file. The remaining component values were set to zero.
plt.figure(figsize=(5, 3.5))
ax = plt.subplot(projection="csdm")
ax.plot(mass_spec)
plt.tight_layout()
plt.show()
Total running time of the script: (0 minutes 0.109 seconds)