
Note
Go to the end to download the full example code.
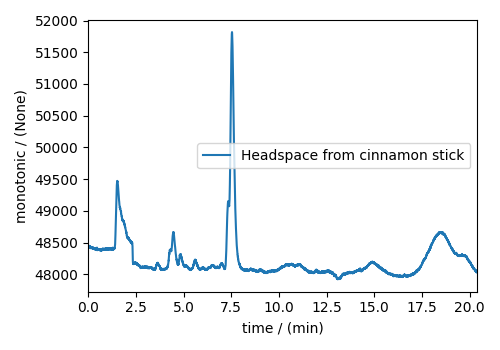
Gas Chromatography dataset
The following Gas Chromatography dataset was obtained as a JCAMP-DX file, and subsequently converted to the CSD model file-format. The data structure of the gas chromatography dataset follows,
import matplotlib.pyplot as plt

import csdmpy as cp

filename = "https://www.ssnmr.org/sites/default/files/CSDM/GC/cinnamon_base64.csdf"
GCData = cp.load(filename)
print(GCData.data_structure)
{
  "csdm": {
    "version": "1.0",
    "read_only": true,
    "timestamp": "2011-12-16T12:24:10Z",
    "description": "A Gas Chromatography dataset of cinnamon stick.",
    "dimensions": [
      {
        "type": "linear",
        "count": 6001,
        "increment": "0.0034 min",
        "quantity_name": "time",
        "reciprocal": {
          "quantity_name": "frequency"
        }
      }
    ],
    "dependent_variables": [
      {
        "type": "internal",
        "name": "Headspace from cinnamon stick",
        "numeric_type": "float32",
        "quantity_type": "scalar",
        "component_labels": [
          "monotonic"
        ],
        "components": [
          [
            "48453.0, 48444.0, ..., 48040.0, 48040.0"
          ]
        ]
      }
    ]
  }
}
and the corresponding plot
plt.figure(figsize=(5, 3.5))
ax = plt.subplot(projection="csdm")
ax.plot(GCData)
plt.tight_layout()
plt.show()
Total running time of the script: (0 minutes 0.135 seconds)