
Note
Click here to download the full example code
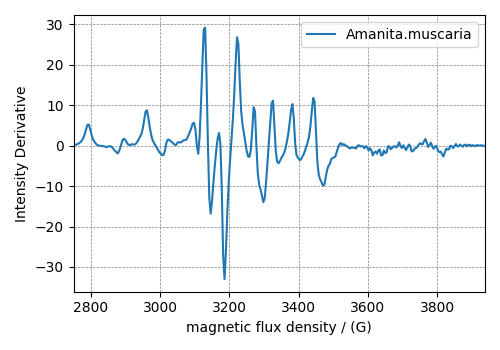
Electron Paramagnetic Resonance (EPR) dataset
The following is a simulation of the EPR dataset, originally obtained as a JCAMP-DX file, and subsequently converted to the CSD model file-format. The data structure of this dataset follows,
import matplotlib.pyplot as plt

import csdmpy as cp

filename = "https://osu.box.com/shared/static/0dh8mwnjr600lh1ufpsmt5780yp7wi99.csdf"
EPR_data = cp.load(filename)
print(EPR_data.data_structure)
Out:
{
  "csdm": {
    "version": "1.0",
    "read_only": true,
    "timestamp": "2015-02-26T16:41:00Z",
    "description": "A Electron Paramagnetic Resonance simulated dataset.",
    "dimensions": [
      {
        "type": "linear",
        "count": 298,
        "increment": "4.0 G",
        "coordinates_offset": "2750.0 G",
        "quantity_name": "magnetic flux density"
      }
    ],
    "dependent_variables": [
      {
        "type": "internal",
        "name": "Amanita.muscaria",
        "numeric_type": "float32",
        "quantity_type": "scalar",
        "component_labels": [
          "Intensity Derivative"
        ],
        "components": [
          [
            "0.067, 0.136, ..., -0.035, -0.137"
          ]
        ]
      }
    ]
  }
}
and the corresponding plot.
plt.figure(figsize=(5, 3.5))
ax = plt.subplot(projection="csdm")
ax.plot(EPR_data)
plt.tight_layout()
plt.show()
Total running time of the script: ( 0 minutes 0.998 seconds)