
Note
Click here to download the full example code
Fourier Transform Infrared Spectroscopy (FTIR) dataset
The following FTIR dataset, was obtained as a JCAMP-DX file, and subsequently converted to the CSD model file-format. The data structure of the FTIR dataset follows,
import csdmpy as cp

filename = "https://osu.box.com/shared/static/0iw0egupb1hkulkbdq4hagzzhkbvqjkv.csdf"
FTIR_data = cp.load(filename)
print(FTIR_data.data_structure)
Out:
{
  "csdm": {
    "version": "1.0",
    "read_only": true,
    "timestamp": "2019-07-01T21:03:42Z",
    "description": "An IR spectrum of caffeine.",
    "dimensions": [
      {
        "type": "linear",
        "count": 1842,
        "increment": "1.930548614883216 cm^-1",
        "coordinates_offset": "449.41 cm^-1",
        "quantity_name": "wavenumber",
        "reciprocal": {
          "quantity_name": "length"
        }
      }
    ],
    "dependent_variables": [
      {
        "type": "internal",
        "name": "Caffeine",
        "numeric_type": "float32",
        "quantity_type": "scalar",
        "component_labels": [
          "Transmittance"
        ],
        "components": [
          [
            "99.31053, 99.08212, ..., 100.22944, 100.22944"
          ]
        ]
      }
    ]
  }
}
and the corresponding plot.
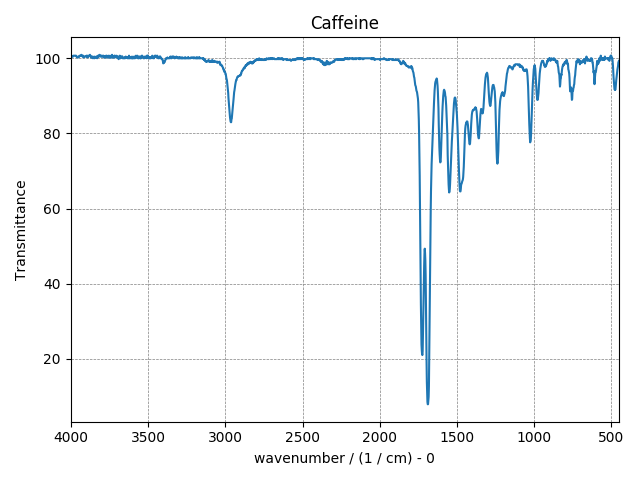
Because, FTIR spectrum is conventionally displayed on a reverse axis, an
optional reverse_axis argument is provided to the plot() method.
Its value is an order list of boolean, corresponding to the order of the
dimensions.
Total running time of the script: ( 0 minutes 1.136 seconds)